Woolpert Digital Innovations

Woolpert Insights Toolkit Showcases

Proprietary, AI-driven solutions built on Google Cloud, Gemini Enterprise and Google Maps Platform. Every entry below is a working application, not a slide — open it and drive it.

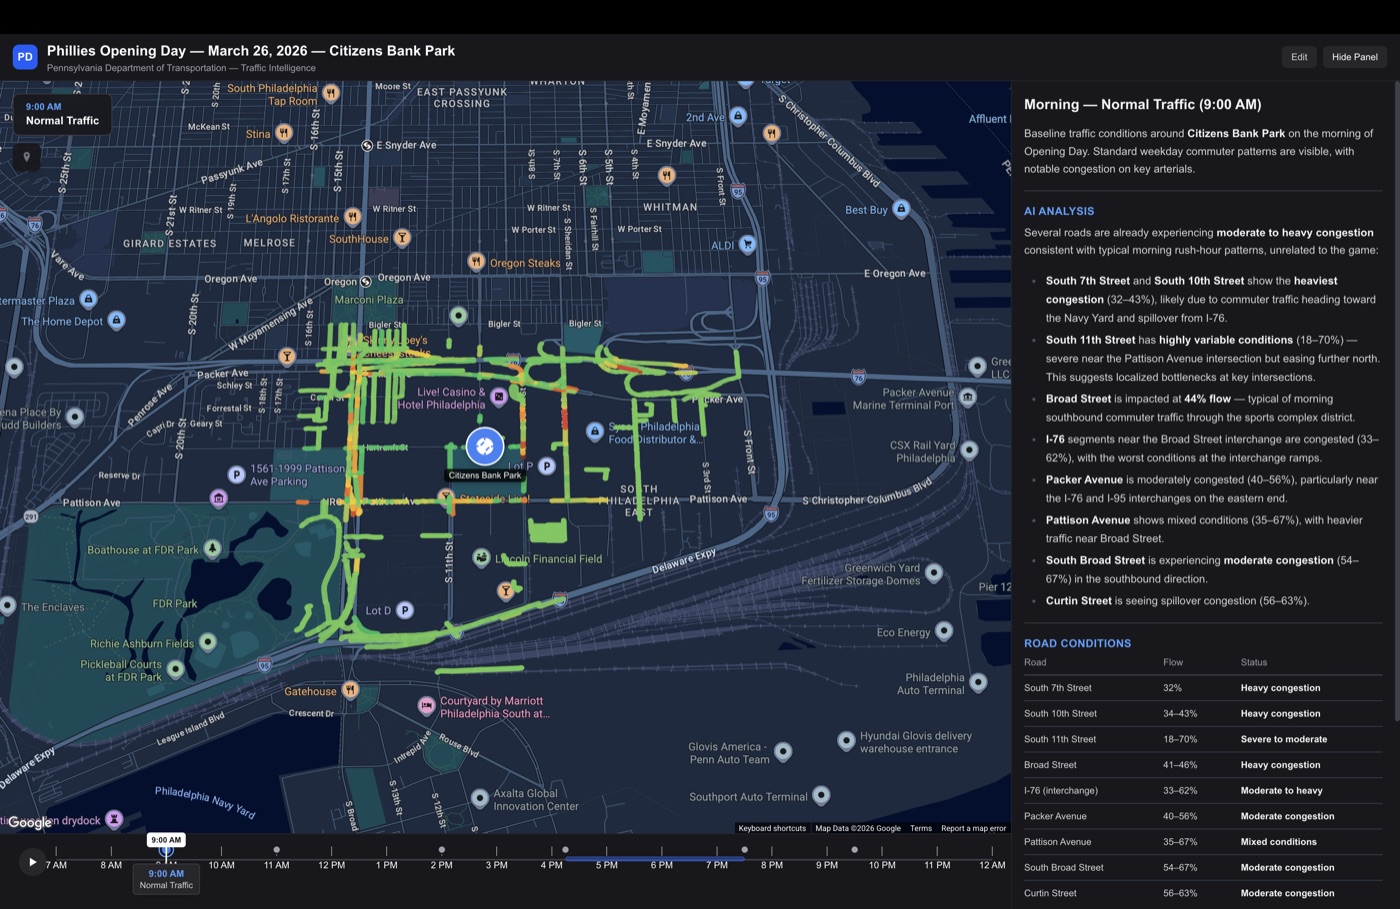
Dark traffic map of South Philadelphia around Citizens Bank Park, road segments coloured green through red, with a timeline along the bottom and an AI analysis panel on the right.

Phillies Opening Day — Traffic Intelligence

A minute-by-minute replay of traffic around Citizens Bank Park on Opening Day, March 26 2026. Scrub the timeline to watch road segments shift from free-flowing green to gridlocked black across the pre-game rush, first pitch, and post-game exodus — each moment paired with an AI read of which corridors are failing and why.

Google Maps Platform Traffic analytics Event operations
Who it's for State and municipal DOT traffic operations teams, and the event and corridor planners who need to see congestion build and clear around a major venue.
Open demo
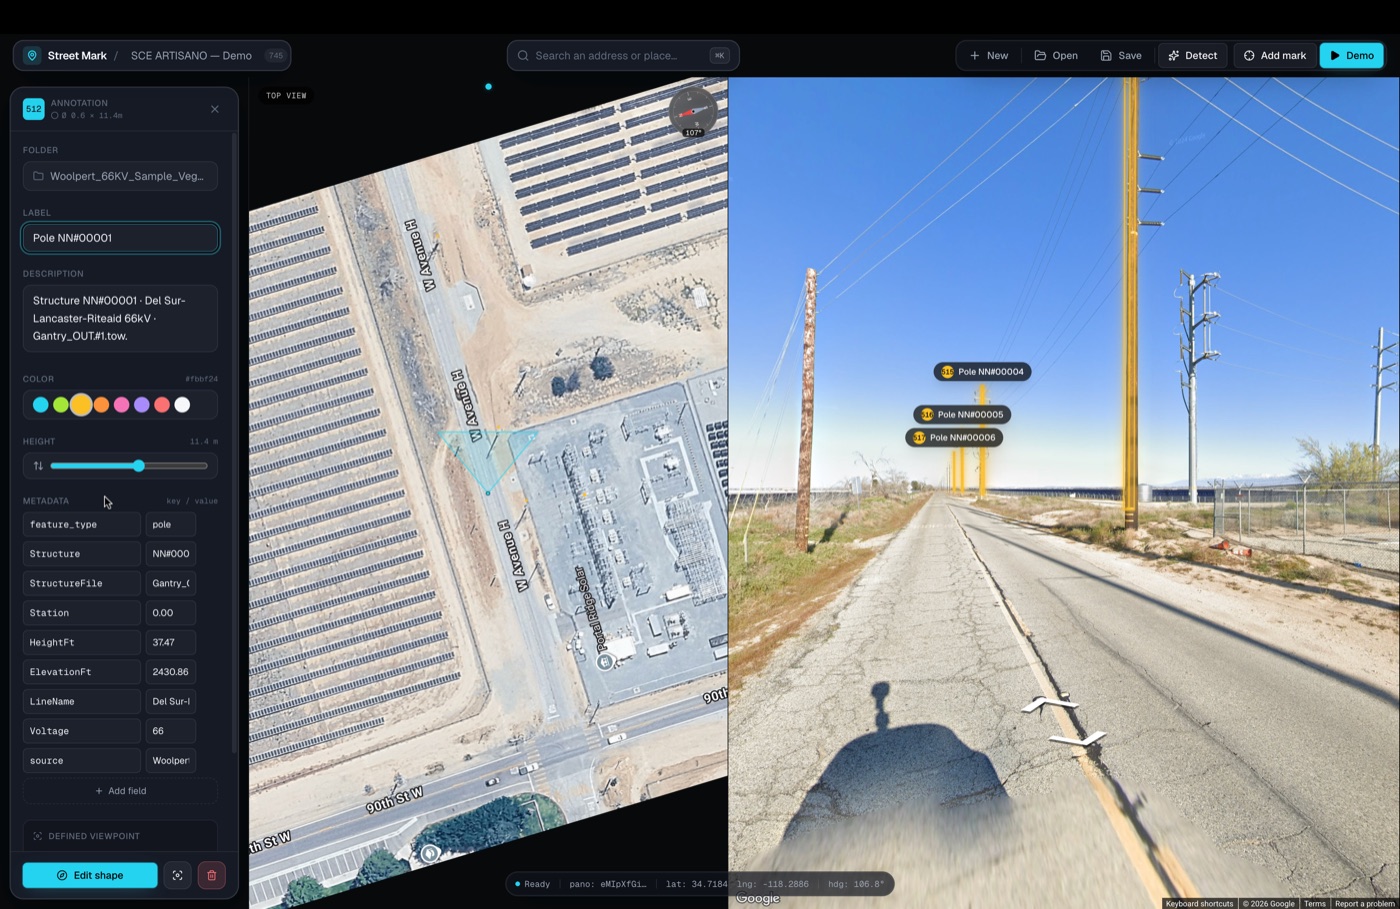
Street Mark's annotation editor beside a top-down aerial view and street-level imagery, with 3D labels pinned to utility poles and a metadata panel listing asset type, height and voltage.

Street Mark

Annotate street-level and aerial imagery with 3D markers — place them by hand, or let AI object detection find the assets and place them for you. Every mark carries structured metadata: asset type, height, voltage, source. It turns a drive-by survey into an inventory a person reviews rather than builds from scratch.

AI object detection Street View imagery Asset inventory
Who it's for Utilities and infrastructure owners running inspection and asset programmes at network scale — transmission and distribution operators, DOTs and municipalities cataloguing tens of thousands of field assets rather than a single corridor.
Open demo
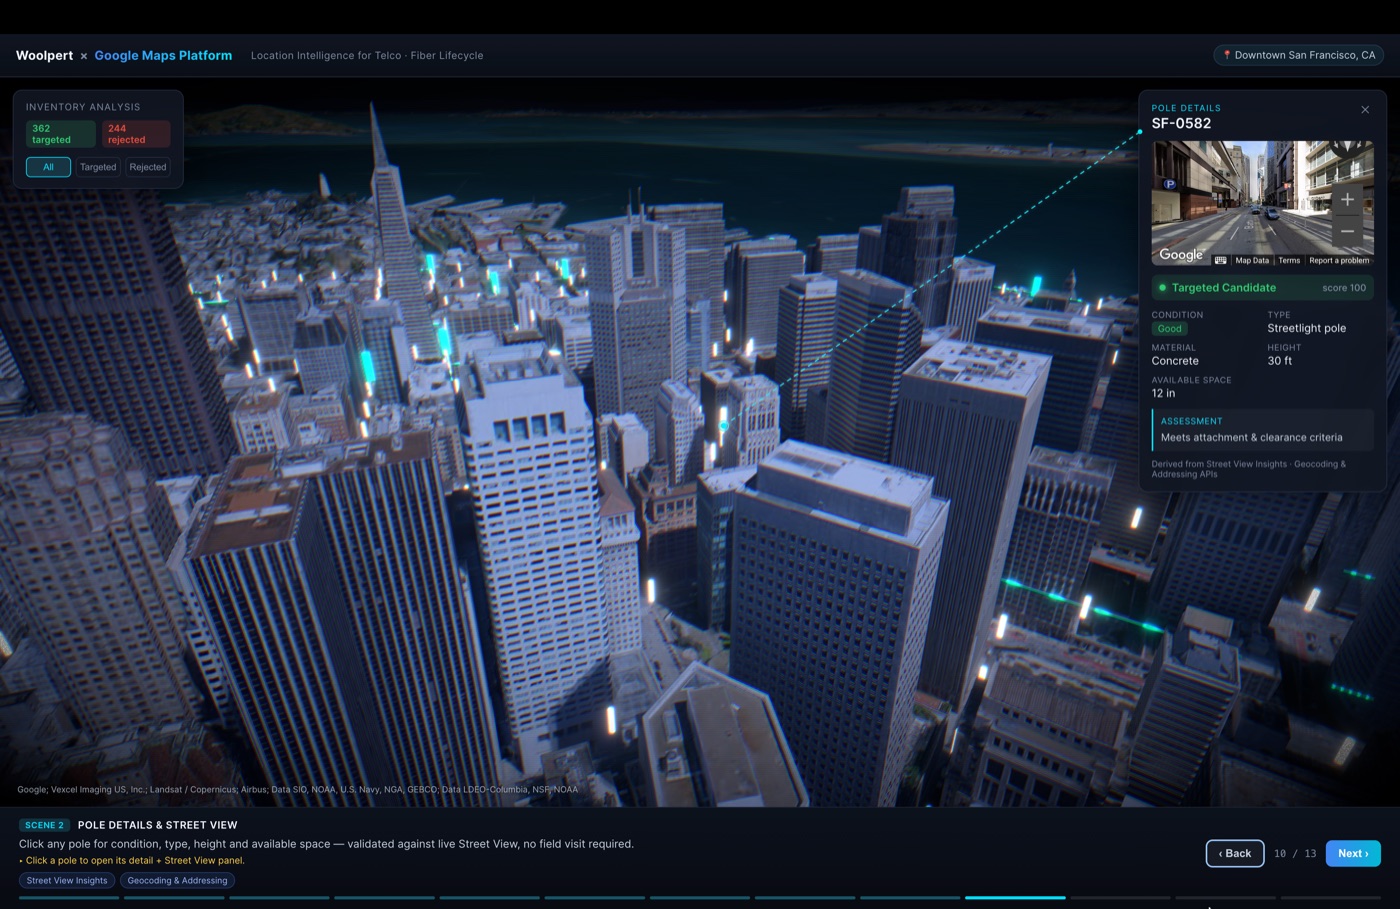
Photorealistic 3D model of downtown San Francisco with candidate poles lit in cyan, a pole detail panel showing condition, type, height and available attachment space beside a Street View thumbnail, and an inventory count of targeted versus rejected poles.

Fiber Reach — Population-Led Network Planning

A guided walk through the fiber lifecycle over a photorealistic 3D city. Click any streetlight or utility pole to get its condition, type, height and remaining attachment space, scored as a candidate and checked against live Street View — an attachment survey without the field visit — with population insights showing where the demand that justifies the build actually sits.

Photorealistic 3D Tiles Street View Insights Population insights Network planning
Who it's for Telecom operators and the network planning, engineering and build teams behind them — deciding where fiber goes next, what it can physically attach to, and tracking it through to completion.
Open demo